Amit Joshi
- Web Development
- javascript
- Sentry
- typescript
Tracking JavaScript Errors with Sentry
15 September: Amit Joshi
Tracking JavaScript Errors with Sentry

In this blog I am going to tell you about a real-time errors tracking for JavaScript. Trying to catch errors in your front-end app can be tricky as the problems happen rarely or when you are not looking at the log traces.
On the market, there are many vendors selling you all-in-one solutions to track every possible error in real-time but recently I used one of the best tool which we can used to track the every JS errors at production label.
I do not work for Sentry or have been asked to write this, It’s just a tool I found have useful and wanted to share my experience with you. One reason why Sentry appeals so much to me is the fact it is open source and can be free to use.
Plan:
- About Sentry
- Sign In and create a project
- Integrate Sentry in JavaScript
- First error tracking
1. What Is Sentry ?
Sentry is Open-source error tracking that helps developers to monitor, fix crashes in real time. Don’t forget about boosting the efficiency, improving user experience. Sentry has support for JavaScript, Node, Python, PHP, Ruby, Java and other programming languages.

2. Sign In and create a project
Step 1: Open your Sentry Account. You might need to sign in. Go here
Step 2: Next create a project
Step 3: Choose your language from the list (‘we are going to pick JS’)
Step 4: Set your default alert settings (we are going to select first option)
Step 5: Give your project a name and click on create project button
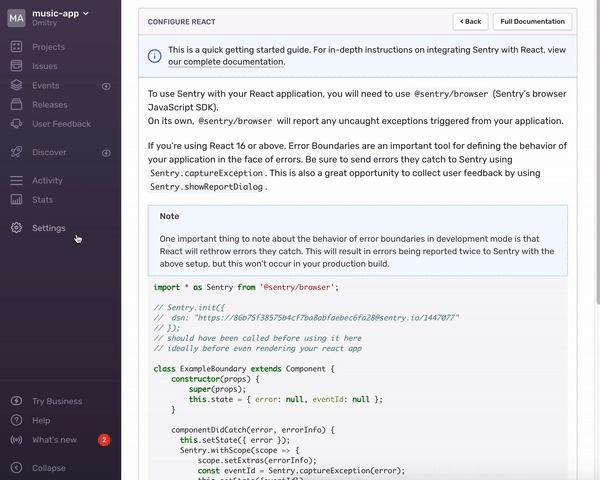
3. Integrate Sentry in JavaScript
First of all, we should install npm package in your project. Sentry captures data by using an SDK within your application’s runtime.
We have two options to install the Sentry SDK using npm or yarn
yarn add @sentry/browser @sentry/tracing
npm install --save @sentry/browser @sentry/tracing
Configure:
Configuration should happen as early as possible in your application’s lifecycle.
Once this is done, Sentry’s JavaScript SDK captures all unhandled exceptions and transactions.
import * as Sentry from "@sentry/browser";
import { Integrations } from "@sentry/tracing";

Sentry.init({
  dsn: "https://examplePublicKey@o0.ingest.sentry.io/0",
  release: "my-project-name@2.3.12",
  integrations: [new Integrations.BrowserTracing()],
  // Set tracesSampleRate to 1.0 to capture 100%
  // of transactions for performance monitoring.
  // We recommend adjusting this value in production
  tracesSampleRate: 1.0,
});
How to find DSN property:
DSN property has in Settings -> Projects -> Client Keys(DSN). Or you can find Client Keys in search input.
4. First error tracking
Let’s throw a simple error and you will see the first issue appear inside the Sentry dashboard.
myUndefinedFunction();
And, if you go to the Sentry page, you will see this nice error appear.
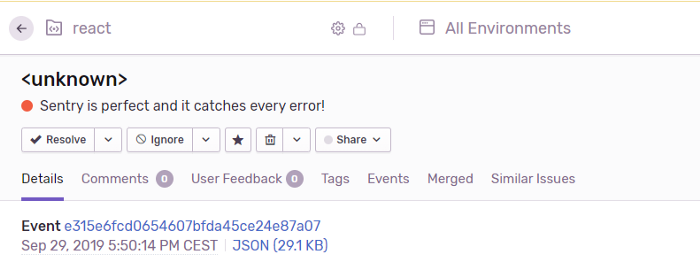
Whoo-hoo! 🎉 🎉 🎉

If you click title error, you’ll see a stack trace.
Conclusion:
Today we’ve described at one of the ways to track the JavaScript errors. I hope you will start catching every error using Sentry.
Thank You
Tracking JavaScript Errors with Sentry
15 September: Amit Joshi
Tracking JavaScript Errors with Sentry
In this blog I am going to tell you about a real-time errors tracking for JavaScript. Trying to catch errors in your front-end app can be tricky as the problems happen rarely or when you are not looking at the log traces.
On the market, there are many vendors selling you all-in-one solutions to track every possible error in real-time but recently I used one of the best tool which we can used to track the every JS errors at production label.
I do not work for Sentry or have been asked to write this, It’s just a tool I found have useful and wanted to share my experience with you. One reason why Sentry appeals so much to me is the fact it is open source and can be free to use.
Plan:
- About Sentry
- Sign In and create a project
- Integrate Sentry in JavaScript
- First error tracking
1. What Is Sentry ?
Sentry is Open-source error tracking that helps developers to monitor, fix crashes in real time. Don’t forget about boosting the efficiency, improving user experience. Sentry has support for JavaScript, Node, Python, PHP, Ruby, Java and other programming languages.
2. Sign In and create a project
Step 1: Open your Sentry Account. You might need to sign in. Go here
Step 2: Next create a project
Step 3: Choose your language from the list (‘we are going to pick JS’)
Step 4: Set your default alert settings (we are going to select first option)
Step 5: Give your project a name and click on create project button
3. Integrate Sentry in JavaScript
First of all, we should install npm package in your project. Sentry captures data by using an SDK within your application’s runtime.
We have two options to install the Sentry SDK using npm or yarn
yarn add @sentry/browser @sentry/tracing
npm install --save @sentry/browser @sentry/tracing
Configure:
Configuration should happen as early as possible in your application’s lifecycle.
Once this is done, Sentry’s JavaScript SDK captures all unhandled exceptions and transactions.
import * as Sentry from "@sentry/browser";
import { Integrations } from "@sentry/tracing";

Sentry.init({
  dsn: "https://examplePublicKey@o0.ingest.sentry.io/0",
  release: "my-project-name@2.3.12",
  integrations: [new Integrations.BrowserTracing()],
  // Set tracesSampleRate to 1.0 to capture 100%
  // of transactions for performance monitoring.
  // We recommend adjusting this value in production
  tracesSampleRate: 1.0,
});
How to find DSN property:
DSN property has in Settings -> Projects -> Client Keys(DSN). Or you can find Client Keys in search input.
4. First error tracking
Let’s throw a simple error and you will see the first issue appear inside the Sentry dashboard.
myUndefinedFunction();
And, if you go to the Sentry page, you will see this nice error appear.
Whoo-hoo! 🎉 🎉 🎉
If you click title error, you’ll see a stack trace.
Conclusion:
Today we’ve described at one of the ways to track the JavaScript errors. I hope you will start catching every error using Sentry.
Thank You